New article - Is NTA ready for regulatory application?
Is Nontarget Analysis Ready for Regulatory Application? Influence of Peak-Picking Algorithms on Data Analysis
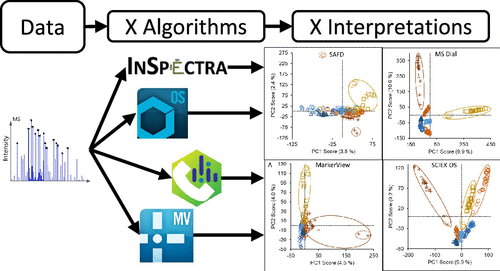
The use of peak-picking algorithms is an essential step in all nontarget analysis (NTA) workflows. However, algorithm choice may influence reliability and reproducibility of results. Using a real-world data set, the aim of this study was to investigate how different peak-picking algorithms influence NTA results when exploring temporal and/or spatial trends. For this, drinking water catchment monitoring data, using passive samplers collected twice per year across Southeast Queensland, Australia (n = 18 sites) between 2014 and 2019, was investigated. Data were acquired using liquid chromatography coupled to high-resolution mass spectrometry. Peak picking was performed using five different programs/algorithms (SCIEX OS, MSDial, self-adjusting-feature-detection, two algorithms within MarkerView), keeping parameters identical whenever possible. The resulting feature lists revealed low overlap: 7.2% of features were picked by >3 algorithms, while 74% of features were only picked by a single algorithm. Trend evaluation of the data, using principal component analysis, showed significant variability between the approaches, with only one temporal and no spatial trend being identified by all algorithms. Manual evaluation of features of interest (p-value <0.01, log fold change >2) for one sampling site revealed high rates of incorrectly picked peaks (>70%) for three algorithms. Lower rates (<30%) were observed for the other algorithms, but with the caveat of not successfully picking all internal standards used as quality control. The choice is therefore currently between comprehensive and strict peak picking, either resulting in increased noise or missed peaks, respectively. Reproducibility of NTA results remains challenging when applied for regulatory frameworks. here.

